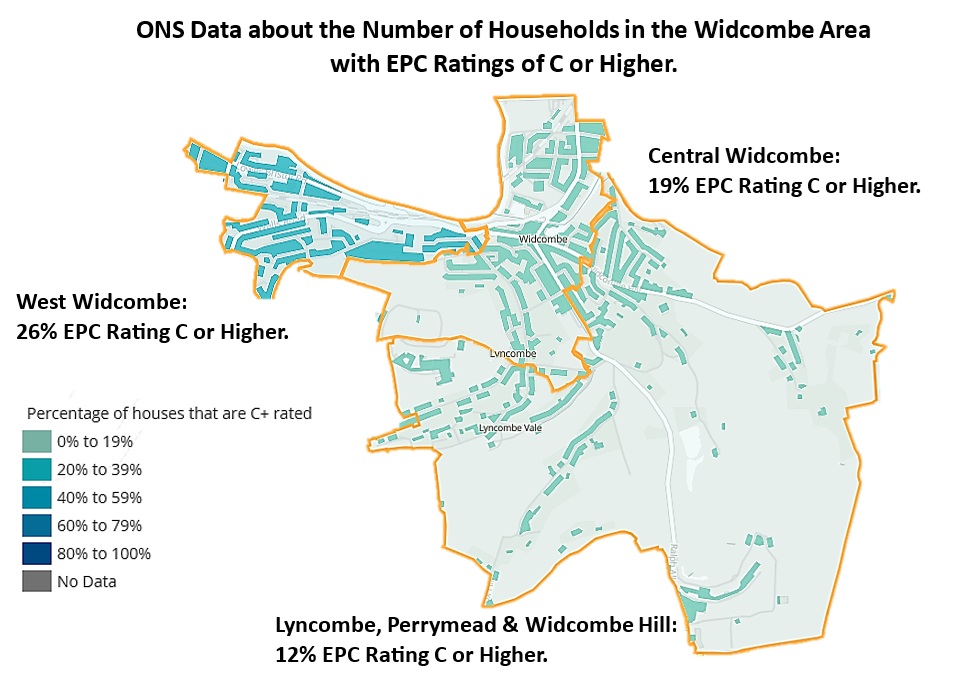
The Office for National Statistics (ONS) provides an indication of the percentage of Houses in each of the 3 main Widcombe areas (West WIdcombe, Central Widcombe and Lyncombe Vale/Perrymead/Widcombe Hill) with EPC Ratings of C or better. This data is summarised in the chart below. It is probably no surprise that West Widcombe has the best EPC Ratings across the whole district (26% EPC Rating of C or higher), because it mainly comprises of more modern housing types. This ONS Data was based upon 2021 Census information. It also shows that we’ve got some way to go to make our overall EPC Ratings better.
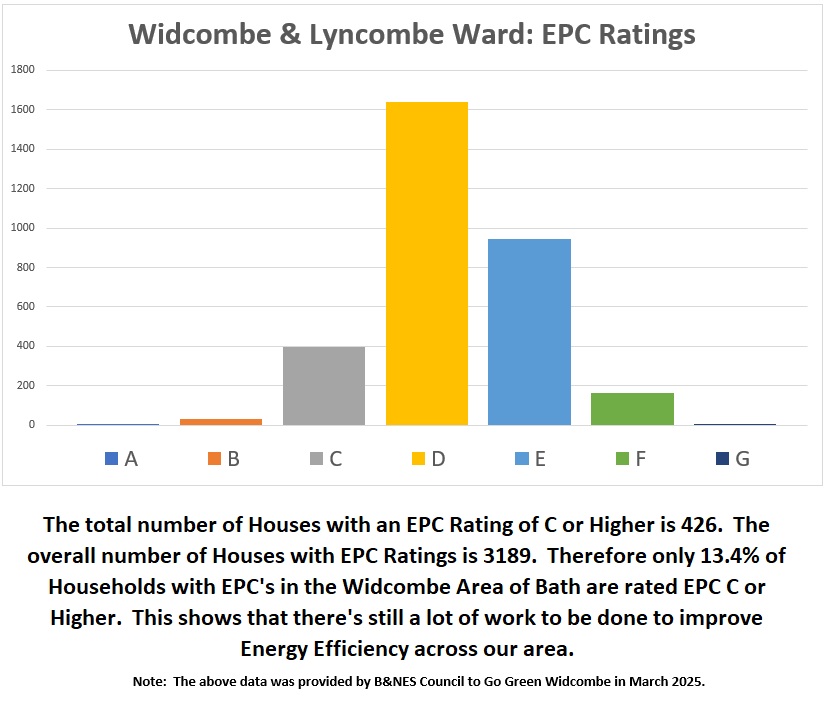
Other data about EPC Ratings across the whole of the Widcombe & Lyncombe area was provided to Go Green Widcombe, by B&NES Council, in March 2025. This gives a summary of the number of houses with EPC Ratings from A (the best) to G (the worst). This data, shown as a simple chart below, is understood to be more up to date than the 2021 Census summary that was obtained from the Office for National Statistics. B&NES Council obtained this data from the Parity Projects website. This chart shows that only 13.4% of Households with EPC Ratings, across Widcombe & Lyncombe have EPC’s of C or higher. Again, this emphasises the need for Households to become more energy efficient.
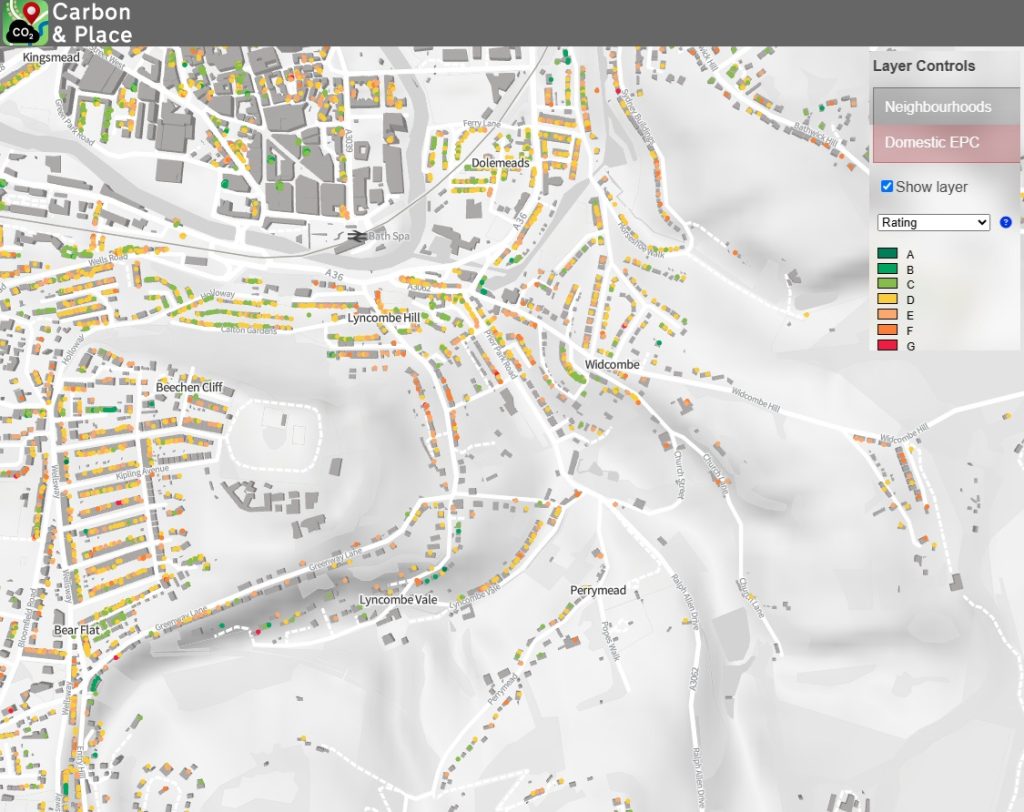
The Carbon & Place website gathers many forms of data. This map below shows the known EPC Ratings across the Widcombe & Lyncombe area of Bath. These are Domestic EPC Ratings with A (in Dark Green) being the most Energy Efficient and G (in Red) being the least Energy Efficient. As the graph above shows, most of the Houses on this map have an EPC Rating of D. This link will take you to the map and then you can zoom in and click on each house with an EPC Rating for more information… https://www.carbon.place/retrofit/#/epc_dom/#14.57/51.37387/-2.35316
Note: If, when using the above link, you can’t get access to a map (as shown below) then (a) close the “Retrofit Explorer” that may appear by clicking on the “X” (top right) then (b) click on the “Change Basemap” option (on the left-hand side of the screen, which appears as 3 overlaying squares). Then click on the 5th/final map option on the top row of options (which should be called “OpenCycleMap”). This should then reveal a map similar to that shown below.
As this image is taken from the Carbon & Place website we have to include this information… Morgan, Malcolm, Anable, Jillian, & Lucas, Karen. (2021). A place-based carbon calculator for England. Presented at the 29th Annual GIS Research UK Conference (GISRUK), Cardiff, Wales, UK (Online): Zenodo. http://doi.org/10.5281/zenodo.4665852