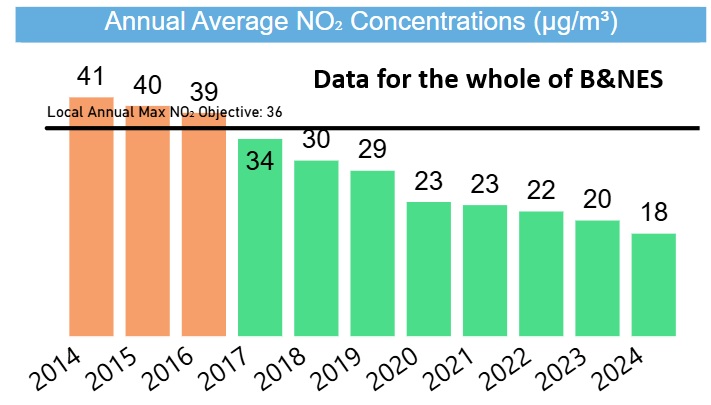
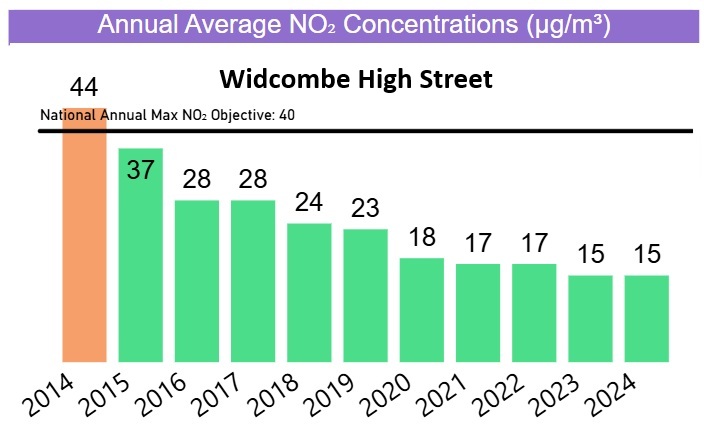
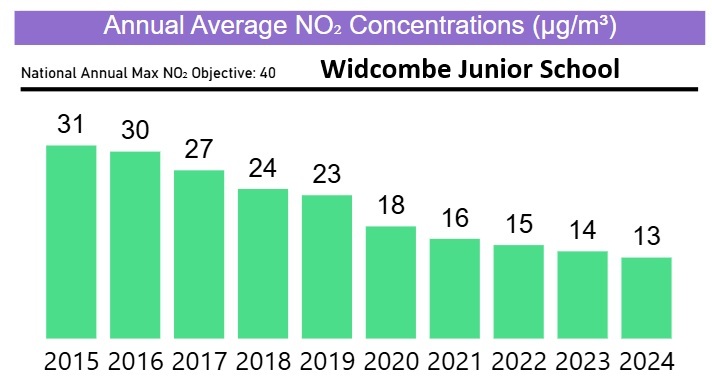
The UK government set the target for annual mean NO2 levels at less than 40 micrograms per cubic meter (µg/m3) in 2010 through the Air Quality Standards Regulations (2010). This legislation resulted in Local Councils installing monitoring systems to check on NO2 levels. B&NES Council have installed various types of Air Quality Monitoring equipment across the whole B&NES area… but most are in the city of Bath. The Council also allow residents to access Average Annual NO2 levels via this webpage. There are several Air Quality Monitoring devices within the Widcombe Area of Bath which measure the Average Annual NO2 levels, and data is currently available from 2014 to 2024. Below are charts showing how the Average Annual NO2 levels have dropped for (a) the whole of Bath and (b) for two areas of Widcombe (the High Street and the Junior School, although the data for the Junior School doesn’t include 2014 for some reason).
In March 2021 B&NES Council introduced a Class C Clean Air Zone across Bath, in order to reduce air pollution throughout the city. As part of this initiative, they also set the target for the annual mean NO2 levels at 36 µg/m3, which is 10% below the UK Government Target of 40 µg/m3. The 3 graphs below show that the Annual Average NO2 concentration levels have been below the 36 µg/m3 target since 2017.
Over the past 3 years the figures for Widcombe have been lower than the average for for the whole of B&NES. However, what this data doesn’t show is how the levels of toxins vary by the hour. B&NES do have 3 special monitoring sites which check not only for NO2, but also for Benzene and Particulate Matter (PM), which is classified according to size:
PM₂.₅ is particles that are less than or equal to 2.5 micrometres (µm) in diameter
PM₁₀ is particles that are less than or equal to 10 micrometres (µm) in diameter
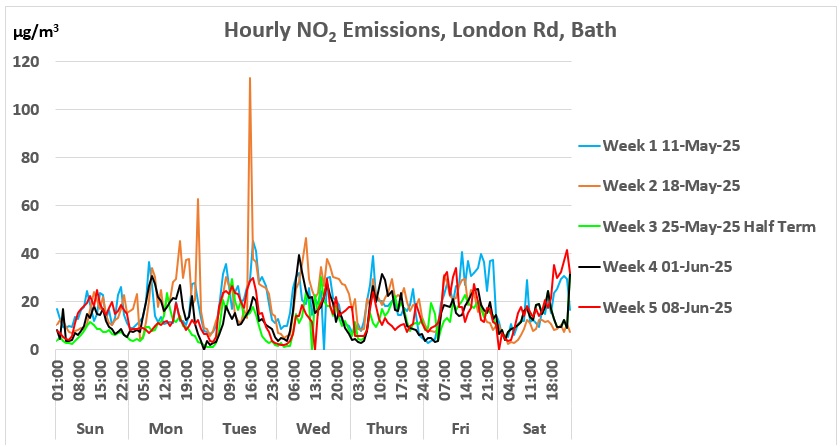
These 3 specific monitoring sites are able to give hourly data… which allows the emissions to be measured throughout the day. This can then show how emissions relate to behavioural activity. One of these hourly meters, on the London Road, near the junction with Snow Hill, is accessible via Defra (see https://uk-air.defra.gov.uk/interactive-map). The graphs below shows the hourly NO2 emissions data for 5 weeks, commencing Sunday 11th May 2025 up to Saturday 14th June. The middle week of this period was School Help Term. These graphs show how the emission levels vary across the day, and they are generally higher during morning and afternoon/evening rush hours. However, on a positive note, during those 5 weeks, there were less than 10 hours when the NO2 level exceeded 40µg/m3! This chart also suggests that the NO2 levels during Half Term aren’t much different to the 2 weeks either side. It is likely that the hourly data for areas in Widcombe will show similar trends to that of London Road, which is a busy thoroughfare, just like Rossiter Road and Pulteney Road..
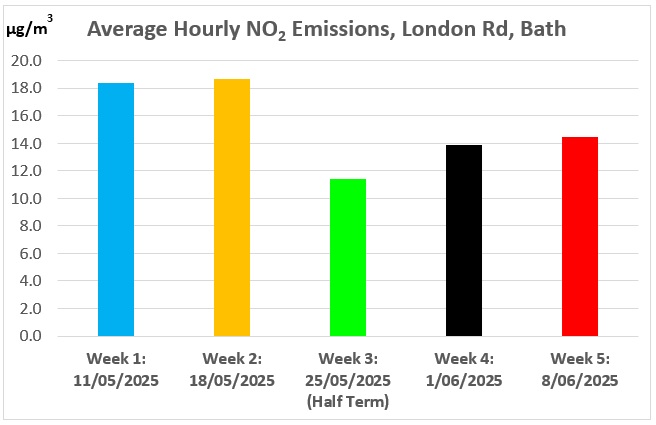
As Half Term is a week when you might expect there to be fewer car journeys (ie. no dropping off kids at school), below is a chart using the same data as above, but summarising it as the Average NO2 emissions per Hour across each of the 5 weeks. This shows that the Half Term week (from Sunday 25th May to Saturday 31st May) was lower than the 2 weeks either side of Half Term. The Average Hourly NO2 emissions for the 2 weeks before and after Half Term was 16.3 µg/m3. The Average Hourly NO2 emissions during Half Term was 11.4 µg/m3, which is a reduction of 30.3%! It is likely that the emission differences during Half Term were similar in the Widcombe area of Bath.