In the B&NES “Net Zero by 2030” Action Plan, dated March 2023, there were 4 Key Targets listed. These were:
- Decarbonising Buildings: Making energy efficiency improvement of the majority of existing buildings (domestic and non-domestic) and zero-carbon new builds.
- Decarbonising Transport: A major shift to mass transport, walking and cycling to reduce transport emissions.
- A rapid and large scale increase in Local Renewable Energy Generation.
- Net Zero Council the Council’s own operations and where it has influence.
So one of the Council’s top priorities is to Decarbonise Buildings (domestic and non-domestic). Their focus in this regard (and the main focus of this Go Green Widcombe website) is to make homes more Energy Efficient. In other areas of the “Information” part of this website, there is data for local Electricity and Gas Usage and Cost, plus a summary of Energy Efficiency Ratings (based upon EPC’s… which aren’t perfect representations of Energy Efficiency, but they’re the ones that are used currently). So, in this section there’s Local Information about Carbon Emissions per Household, across different LSOA’s (Lower layer Super Output Areas).
This section, titled Carbon Emissions, deals not only CO2 Equivalent Emissions from Heating Households, but also from various forms of Transport and General Consumption (of Goods and Services). The original information was published in 2022. This has now been updated by the Centre for Research into Energy Demand Solutions (CREDS), and more information can be found on the latest version of the Carbon and Place website 2026 Update. CREDS have informed Go Green Widcombe that, between 2022 and 2025, two major changes in the collection of data have been introduced:
- The national estimate of consumption carbon emissions has changed. This means we have better trade data on the UK’s imports and exports and can better account for cross-border carbon flows. But has meant more of our carbon footprint is imported though goods and services.
- The method for allocating emissions to local areas has changes substantially. The consumption based parts of the footprint now account for a range of local socio-economic and demographic characteristics rather than simple income bands.
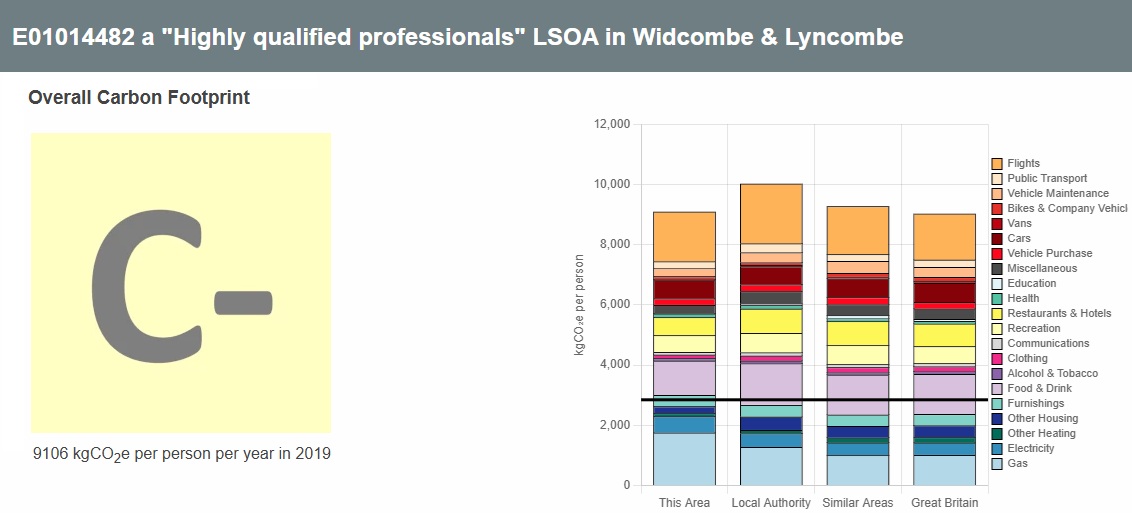
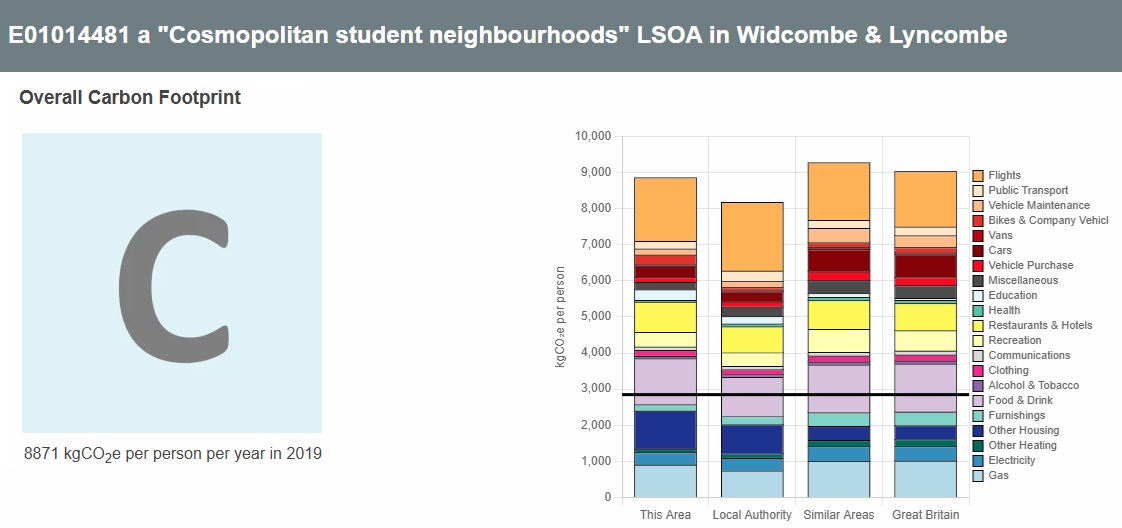
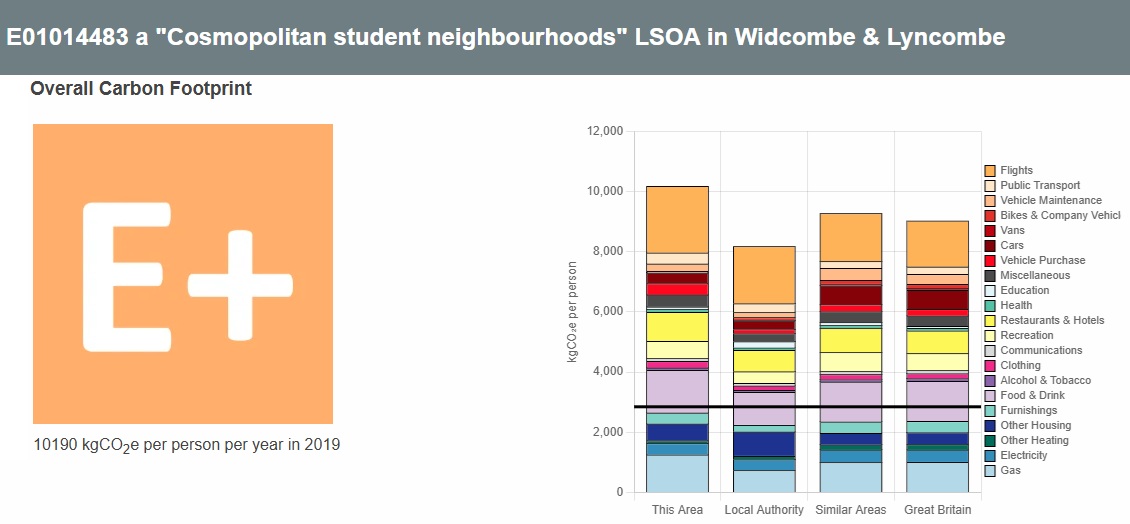
When you click on the above Carbon and Place website link (highlighted in green, above) you’ll be taken to the “Place-based Carbon Calculator” map… specifically to the Widcombe area of Bath. Then you’ll see each LSOA (Lower layer Super Output Areas… as defined by the Office for National Statistics) highlighted in various colours and with boundary lines. You can then click on the area where you live and you’ll be given a summary of the Overall Carbon Footprint for your area. The main areas for Widcombe on this map are West Widcombe (LSOA E01014481), Central Widcombe (LSOA E01014483) and South Widcombe (Lyncombe/Perrymead/Widcombe Hill, LSOA E01014482). Below are the summaries of CO2 Equivalent Emissions for these 3 areas… and the Black Line is the Target for 2032 (clicking on the “Carbon & Place website” link, above, will give you access to the full details). If you click on one of these images, it will pop out and you should be able to see it more clearly.
West Widcombe Data:
Central Widcombe Data:
Lyncombe/Perrymead/Widcombe Hill Data: